
Performance
The top bar always shows two numbers: DSP, the share of each audio buffer spent processing the chain, and CPU. The dot next to them is green, then orange, then red as the load rises. When the DSP load reaches 100 %, the audio drops out.
Tap them to open the resource monitor.
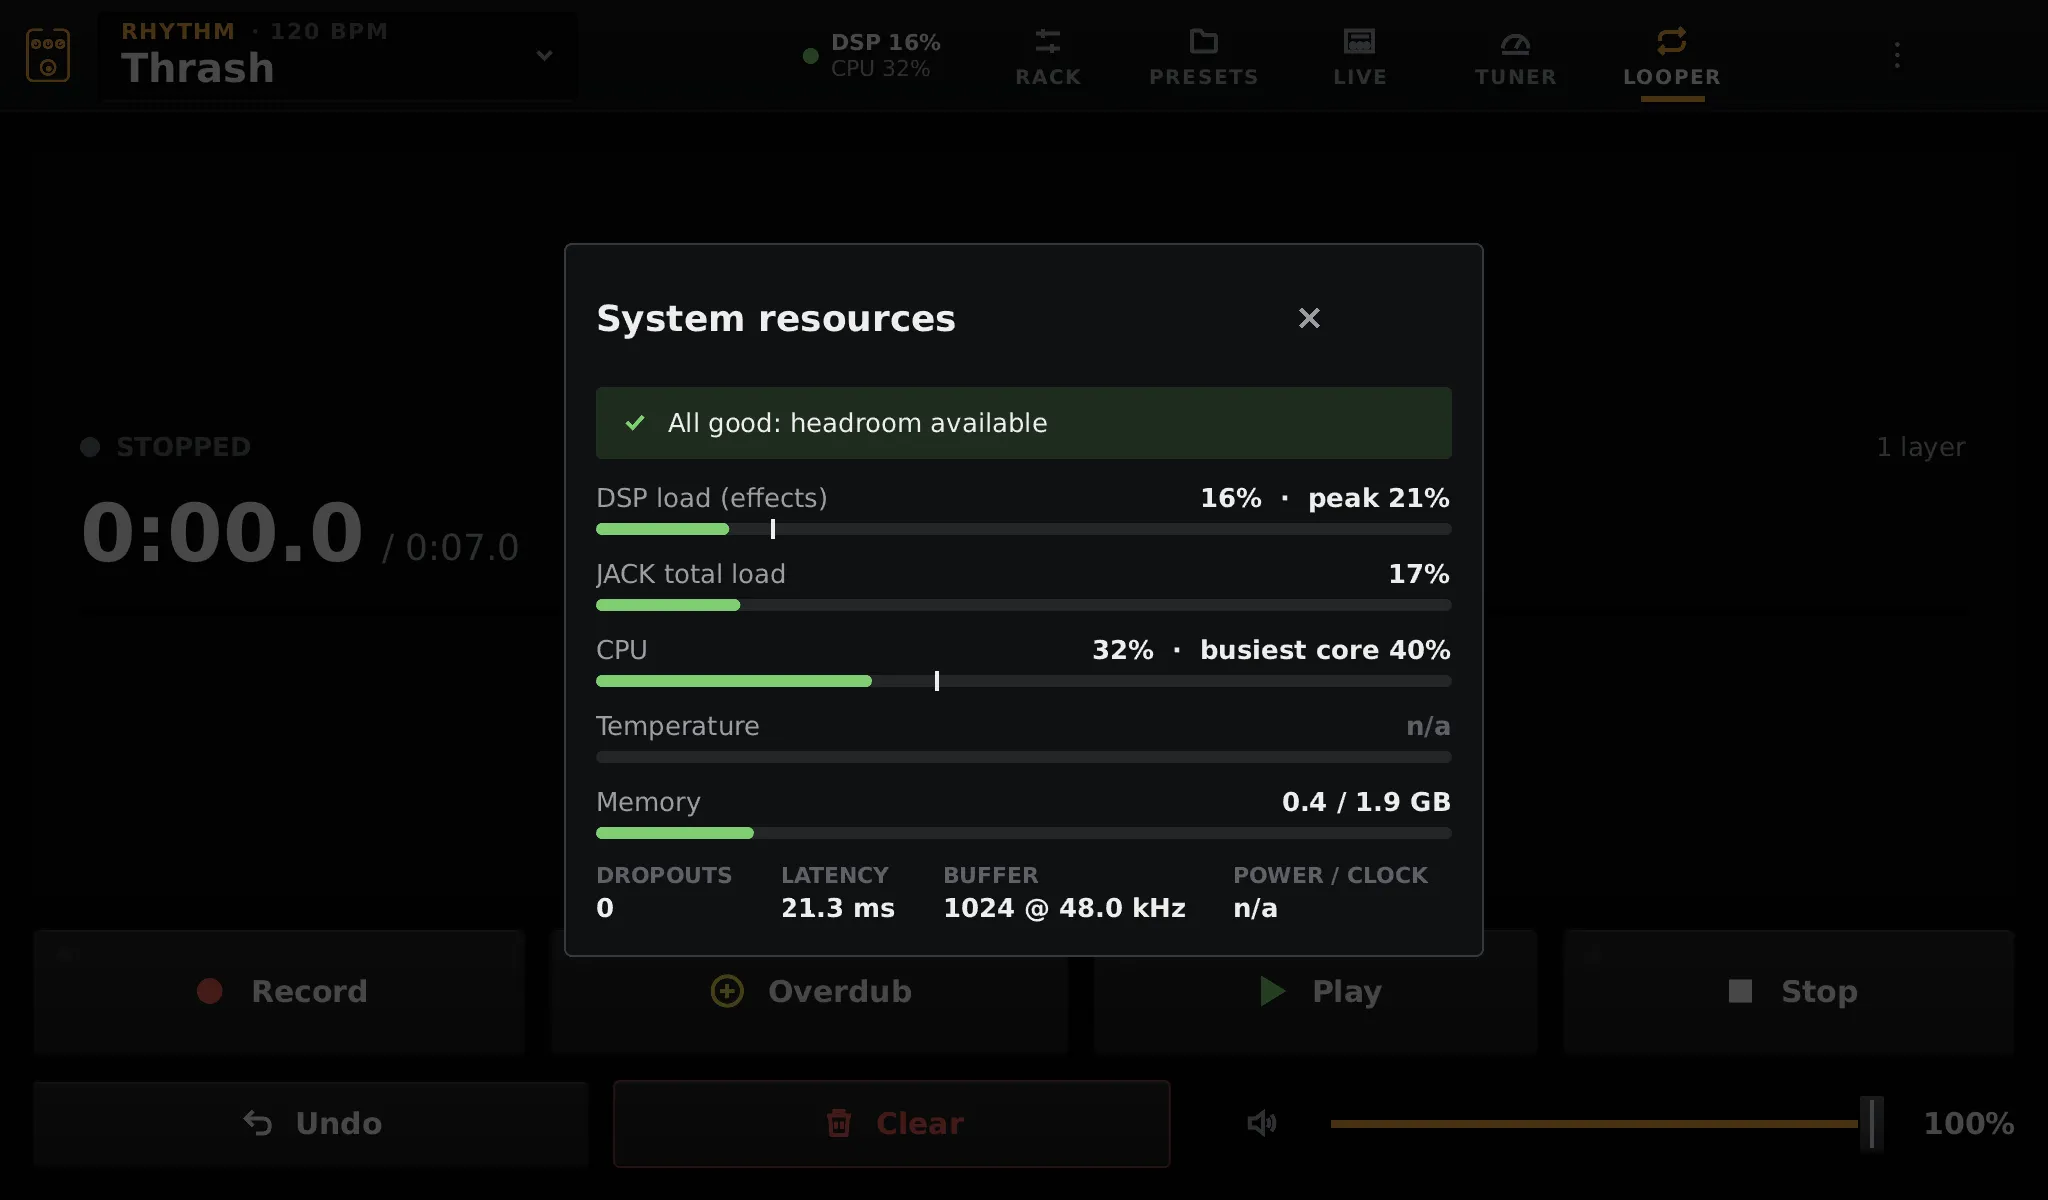
| Line | What it means |
|---|---|
| DSP load (effects) | Time spent processing the chain, against the buffer’s duration: average and peak |
| JACK total load | The audio server’s own measure, the chain included |
| CPU | Total, and the busiest core |
| Temperature | The SoC temperature, on a Pi |
| Memory | Used and total |
| Dropouts | Xruns since start: each one is a click |
| Latency, Buffer | From pedalboard.txt |
| Power / clock | On a Pi: under-voltage and throttling |
The banner at the top sums it up, from “All good: headroom available” to a warning.
Adding a block while the load is already high shows a warning. The block editor shows how much of a CPU core each block uses.
What costs what
Section titled “What costs what”- Neural captures cost the most. A full A2 capture is about 12 % of a Pi 5 core at 128 frames. Use Quality: Light (about a quarter of that) on boosters and pedals, and prefer lite or feather captures when stacking several.
- Impulse responses have a flat, moderate cost; long rooms are convolved partly on another thread.
- In stereo, cabinets, spaces and mono LV2 plugins after the point where the signal becomes stereo run twice.
If you hear clicks
Section titled “If you hear clicks”- Look at the Dropouts count in the monitor while it clicks.
- If the DSP load is high, lighten the chain: Light quality, smaller captures, fewer blocks after a stereo split.
- If the load is low but xruns still rise, raise the buffer:
period=256in pedalboard.txt. - On a Pi, check for under-voltage in the monitor: use the official 27 W supply.